Plotting Data in Org-Mode Tables with Python I wouldn't call it data visualization, but...
Among the huge number of great things about Emacs’ Org-Mode is its table editing and spreadsheet capabilities. Combined with OrgBabel and Python, Org-Mode has a light-weight but capable data visualization tool.
Org-Mode Tables and Spreadsheets
The table editing feature of Org-Mode is an amazing feat of text-based formatting and managing, making tables in a text editor not only possible, but, in many cases, better than the table editing and display capabilities of graphical editors (I’m looking at you, Microsoft Word and Google Docs).
In addition to the table editing, Org-Mode has a simple spreadsheet built in, so taking sums or averages of columns, or applying mathematical operations to two columns and putting the results in a third is straightforward.
For more complicated spreadsheet-like operations, Org-Mode tables can easily become data frames in R or lists (or lists of lists) in Python (or a data structure in other languages) and those data structures can be turned into tables in Org-Mode for export or publication. This is the key to making plots.
Plottable data from table to image
Plotting in Python isn’t always straightforward, but matplotlib’s pyplot makes it workable, so you’ll need Python and matplotlib installed in addition to Emacs and Org-Mode. If you’re reading this, that last sentence might have been insulting: I’m sorry.
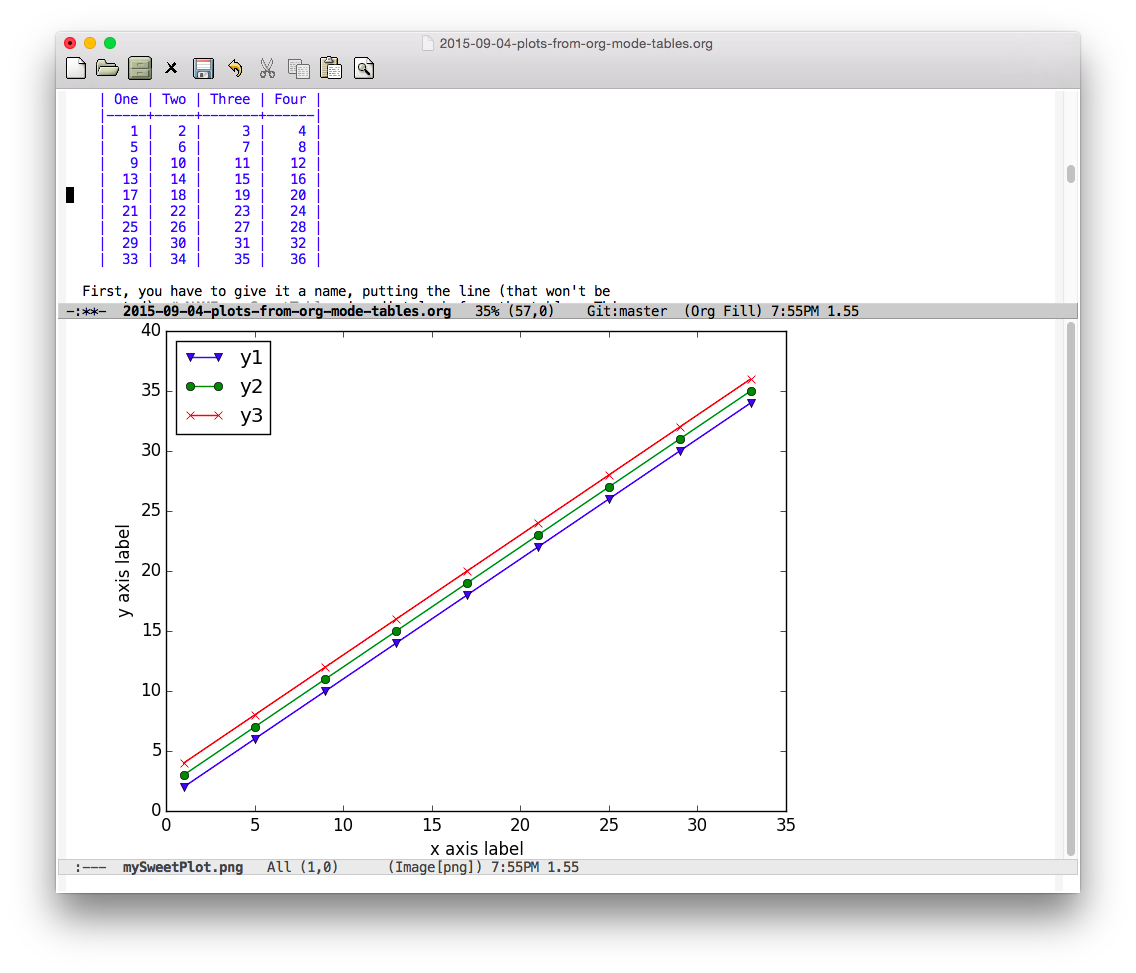
For example, you have a table in Org-Mode that has four columns of numbers:
| One | Two | Three | Four |
|---|---|---|---|
| 1 | 2 | 3 | 4 |
| 5 | 6 | 7 | 8 |
| 9 | 10 | 11 | 12 |
| 13 | 14 | 15 | 16 |
| 17 | 18 | 19 | 20 |
| 21 | 22 | 23 | 24 |
| 25 | 26 | 27 | 28 |
| 29 | 30 | 31 | 32 |
| 33 | 34 | 35 | 36 |
First, you have to give it a name, putting the line (that won’t be
exported) #+NAME: mySweetTable immediately before the table. This
will allow you to refer to the table data in the Babel script that
will plot (or otherwise manipulate) the data.
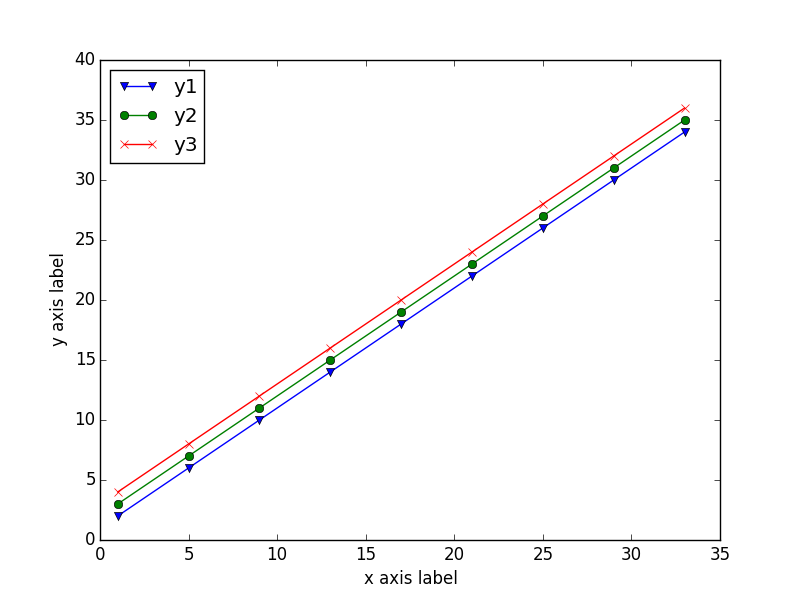
The key to the plot is the very simple Python script:
import matplotlib.pyplot as plt

'''If you have formatting lines on your table
(http://orgmode.org/manual/Column-groups.html) you need to remove them
"by hand" with a line like:

data = data[2:]
'''

'''Turn the table data into x and y data'''
x = [a[0] for a in data]
y1 = [a[1] for a in data]
y2 = [a[2] for a in data]
y3 = [a[3] for a in data]

''' Plot the x and y data'''
a, = plt.plot(x, y1, label="y1", marker='v')
b, = plt.plot(x, y2, label="y2", marker='o')
c, = plt.plot(x, y3, label="y3", marker='x')

''' Set the x and y labels on the graph '''
plt.xlabel("x axis label")
plt.ylabel("y axis label")

''' Create the legend '''
plt.legend(handles=[a,b,c],loc="upper left")

''' Save the PNG file '''
filename = "mySweetPlot.png"
plt.savefig(filename)

''' Return the PNG file path to OrgMode '''
return(filename)
The #+BEGIN_SRC line that starts the OrgBabel section for the
script looks like:
#+BEGIN_SRC python :results file :exports results :var data=mySweetTable
The data is imported into the Python script by referring to the
table name (mySweetTable) in the #+BEGIN_SRC line’s :var
option as the variable that will be in the Python script (in this
case, the cleverly named data variable). And, as you can see, the
columns in the table show up in the Python script as a[0] through
a[3]. If you have more than one table, you can have more than one
:var pythonVar=tableName option on the #+BEGIN_SRC line.
Most of the Python is plotting code, so when you type C-c C-c with
the cursor (point) in the Python code, Org-Mode will run it and put
a link into the document. Moving the cursor (point) onto the link
and pressing C-c C-o the image will open in either Emacs or the
program you have defined to open that file type. If you prefer
another file type, simply change the extension on the file name and
pyplot will save that file type; for details on the available types,
see the pyplot documentation.
While matplotlib can make publication quality plots, these are not those; these plots are simply to quickly see relationships between the data in your tables. For higher quality plots, see prettyplotlib, matplotlib for papers, or any of the many other resources on the Internet on this topic.
15 lines
The 15 lines of Python code (not counting comments) will let you make plots of the data in a 4-column Org-Mode table. Using Org-Mode’s noweb options, you can include this code once in your Org-Mode document and re-use it with different inputs throughout your document for a quick look at the data you have in the tables.
For example, if you name the Python code above plottingcode by
putting the line #+NAME: plottingcode immediately before the
#+BEGIN_SRC line and then add :noweb yes to the end of the
#+BEGIN_SRC line, you can then later refer to that code in a code
block like:
#+BEGIN_SRC python :results file :exports both :var data=myOtherTable
<<plottingcode>>
#+END_SRC
and running that by pressing C-c C-c with the point on or between
the BEGIN and END lines will evaluate the code from the other
location but with the new input—in this case using myOtherTable
as the data variable instead of the original mySweetTable.
And there’s your in-Org-Mode data visualization
With 15 lines of re-usable Python, one useful Python package, you can make simple plots out of your Org-Mode tables that you can see in Emacs.