Time Series Plots with nvd3 plotting time on the x-axis with nvd3; the Internet forsook me
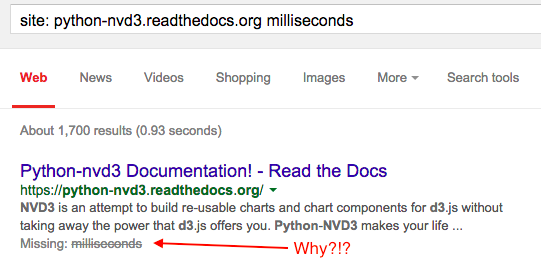
The purpose of this post on plotting time on the x-axis of a plot produced using Python’s nvd3 library is because when I Googled for it (really, does anyone purposefully use Yahoo! or Bing to search for anything?) I got no results. It wasn’t obvious to me, and no matter how many times I Googled it, it wasn’t there. Why is there even an Internet if it can’t help me figure out how to do exactly what I want to do at the exact moment I want to do it?
The problem
- nvd3 is really handy
- many plots are time-series plots
- the Python nvd3 docs don’t mention milliseconds, which is how it
wants time represented:
Getting your times in the right format
This is very simple, really. The most important thing is to realize that the time that nvd3 wants is the number of milliseconds since the epoch. Or add three zeros to the number of seconds since the epoch. So 1439417760 is 12 August 2015 at 18:16 GMT.
In Python, if your times are datetime.datetime types (when printed they look like 2013-05-05 08:51:51), you can convert them to seconds since the Unix epoch in many different ways. One way to convert them is:
import time
import datetime
seconds_since_epoch = time.mktime(myDatetimeTimeVariable.timetuple())
Then simply multiply seconds_since_epoch by 1000 to get
milliseconds.
Plotting Time on the X-Axis of an nvd3 plot
You’ll need to populate some lists with your data, but once you have them, the bits of Python you need to make a nice D3 plot are:
from nvd3 import lineChart

chart = lineChart(name="myChart", x_is_date=True,
                  date_format="%d %b %Y")

chart.set_graph_width(800)
chart.add_serie(y=myYdata, x=myXdata, name='My Awesome Data')
chart.buildhtml()
- The first
chart =line contains two options that are important for plotting date/time values:x_is_date=Trueand the string format for the date set indate_format. - The third line is actually
add_serie, not add_series — it’s French. - The last line builds the HTML for the chart, placing the entire
HTML page in the
chart.htmlcontentvariable. For more on this, see the python-nvd3 Chart Classes Reference.
Now you can print the HTML and open it in a browser, return in via Flask or Bottle or whatever, etc.
An Example
from nvd3 import lineChart
import time
import datetime

# Set up our data

xdata = ['2015-08-01 09:00', '2015-08-02 10:00', '2015-08-03 11:00',
         '2015-08-04 12:00', '2015-08-05 13:00', '2015-08-06 14:00']
ydata = [10, 20, 30, 40, 25, 10]

# Convert xdata to datetime.datetime format
xdata = [datetime.datetime.strptime(s, "%Y-%m-%d %H:%M") for s in xdata]

# Convert datetime.datetime xdata to milliseconds since the epoch
xdata = [time.mktime(s.timetuple()) * 1000 for s in xdata]

# create the lineChart with x_is_date and a date format string
chart = lineChart(name="myChart", x_is_date=True,
                  date_format="%d %b %Y")
# set the width of the chart
chart.set_graph_width(800)
# add the data to the chart
chart.add_serie(y=ydata, x=xdata, name='My Awesome Data')
# build the HTML for the chart; you might prefer buildcontent() for an embeddable chart
chart.buildhtml()

# print the data
print chart.htmlcontent