Plotting Functions for Kids (and Adults) on an Apple Computer plot functions for free!
To plot functions on the computer, you need to install a program
called gnuplot. See the section below called Installing gnuplot for
how to do that.
To start gnuplot you first have to open the Terminal program on your
Mac. You will be able to type into that window. You should type
gnuplot and press Return. Then you’ll see:
	G N U P L O T
	Version 5.2 patchlevel 6    last modified 2019-01-01

	Copyright (C) 1986-1993, 1998, 2004, 2007-2018
	Thomas Williams, Colin Kelley and many others

	gnuplot home:     http://www.gnuplot.info
	faq, bugs, etc:   type "help FAQ"
	immediate help:   type "help"  (plot window: hit 'h')

Terminal type is now 'qt'
gnuplot>
Now you need to do a few things to set up the plot. To turn on grid
lines, type set grid and press Return. It will look like:
gnuplot> set grid
gnuplot>
Next you need to define your functions. Their names can be anything
you want and they are what will appear in the legend, so chose
something that makes sense (it is possible to change the legend, but
it is easier to let gnuplot chose it for you. For example, we will
use the names noshrink and mighty from a recent math homework.
Formulae in gnuplot are not represented with x and y, but with
f(x) and x, where f(x) is just like y and the f part can be
any name. This will look like:
gnuplot> noshrink(x) = 4.5 * x
gnuplot> mighty(x) = x + 45
gnuplot>
and this is the same as \(y = 4.5 \times x\) for noshrink and
\(y = x + 45\) for mighty.
At this point, you have done three things:
- Turned on the grid in your plot
- Defined the formula for
noshrink - Defined the formula for
mighty
You can define as few as one formula or as many as you want.
To plot your formulae and see them on the screen, you need to know
what the range of x values are that you want to use. In the example
below we have chosen a range from 0 to 60 by typing x=[0:60] as part
of the plot command:
gnuplot> plot [x=0:60] noshrink(x), mighty(x)
gnuplot>
and you will see a window pop up on the screen that looks like the picture in Figure 1.
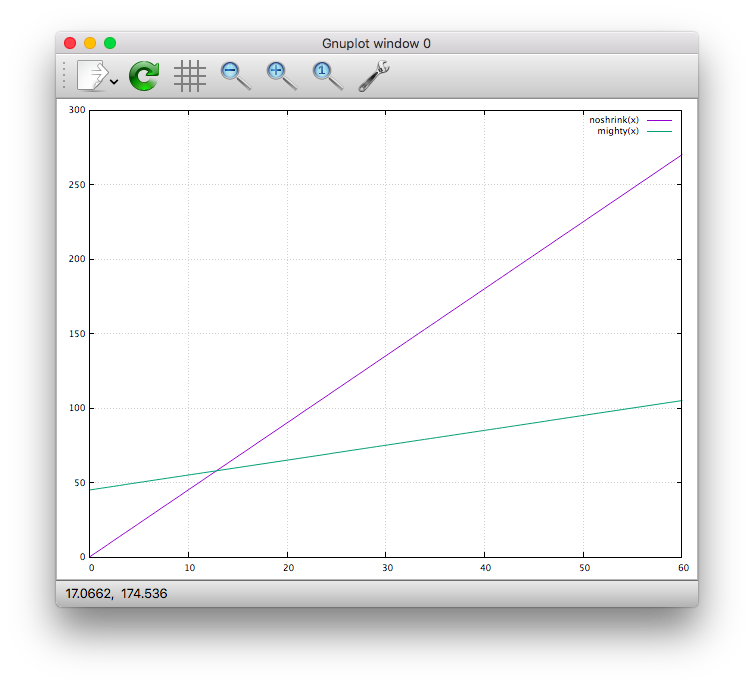
Figure 1: A sample plot
If the plot looks right, you can save it to a PDF file for printing or
emailing. Saving a plot to a PDF is a few more steps that you have to
type at the gnuplot> prompt. You need to set the output type (PDF)
and the name of the output file and then make the plot again and
finally set the output back to the screen:
gnuplot> set term pdf

Terminal type is now 'pdfcairo'
Options are ' transparent enhanced fontscale 0.5 size 5.00in, 3.00in '
gnuplot> set output "my-plot.pdf"
gnuplot> replot
gnuplot> unset term

Terminal type is now 'qt'
gnuplot>
You can change the name of the file from my-plot.pdf to anything you
want; it’s best to end it with .pdf though. You can open the PDF
file with Preview and print it if you want. To open the file in
Preview without exiting gnuplot you can type ! open my-plot.pdf
(or whatever the name of your files is) at the gnuplot> prompt,
like:
gnuplot> !open my-plot.pdf
gnuplot>
and Preview will open and show you your file.
When you’re done, you can exit gnuplot by typing exit and pressing
Return.
Installing gnuplot
You can install gnuplot two ways. The best way is to first
install brew by going to https://brew.sh/ and following the
instructions; you will have to open the Terminal program to do this.
When brew is installed, in Terminal (it can be the same one or a
new one) type brew install gnuplot and wait for it to install.
Then you can follow the instructions above.
You can also go to http://www.gnuplot.info/ and follow the
instructions there to install it. It is really easier to install it
using brew, though. If you aren’t using a Mac, you can still
install gnuplot and follow most of the instructions here, but some
things may look or act slightly different.
Why would I want to do this?
I don’t know, I guess you want to plot functions without buying
software. You’ve read this far, though, so I can tell you why I
did this. My daughter is learning about functions in Math and as
part of their homework they have to plot them. She has a graphing
calculator and graph paper, but computers are better at making
useful plots than either of those things. gnuplot is free and
straightforward to use (and, if you start using it more, it can be
very powerful, so it’s not a bad thing to learn about) and runs on
Macs and Windows and Linux and probably many other kinds of
computers, so it was a better option than buying software. Also,
public school teachers with tiny budgets might find this helpful for
making their lessons or quizzes or examples or whatever.
There are many, many resources on the Internet on using Gnuplot. There are also some good books about it, like Gnuplot in Action from Manning Publications (I don’t benefit from these links, I’m just a satisfied customer).
- gnuplot 1
- function 1
- plot 4
- kids 1
- mac 2
- simple 4
- algebra 1
- school 1
- education 1
- math 1
- free 1
- simple 4
- easy 1
- pdf 3